Statistical analysis of vehicle loads measured with three different vehicle weighing devices
JavaScript is disabled for your browser. Some features of this site may not work without it.
- ResearchSpace
- →
- Research Publications/Outputs
- →
- Conference Publications
- →
- View Item
| dc.contributor.author |
Mkhize, ZQP

|
|
| dc.contributor.author |
De Beer, Morris
|
|
| dc.date.accessioned | 2008-01-21T08:36:16Z | |
| dc.date.available | 2008-01-21T08:36:16Z | |
| dc.date.issued | 2005-07 | |
| dc.identifier.citation | Mkhize, Z.Q.P. and De Beer, M. 2005. Statistical analysis of vehicle loads measured with three different vehicle weighing devices. SATC 2005: The 24th Annual Southern African Transport Conference and Exhibition, Pretoria, South Africa, 11-13 July, 2005, pp. 1-19 | en |
| dc.identifier.uri | http://hdl.handle.net/10204/1866 | |
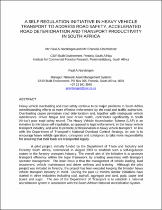
| dc.description.abstract | This study introduces a new scale for weighing individual tyres of slow moving vehicles. The new technology is referred to as “Stress - In – Motion” or SIM and is statistically compared with an existing Weigh-In-Motion (WIM) scale (DAW 50) and a Multi-Deck Static scale at the N3 Traffic Control Centre (N3-TCC), near Heidelberg. The raw data was validated for quality, resulting in a total usable sample of 2 297 trucks (12 830 axles) from the SIM device. The validated paired data indicated that the SIM data compares very linearly to the mass weight results of both the DAW 50 and Static scales. However, he SIM data underestimated the average gross vehicle Mass (GVM), or gross combination mass (GCM) by 6 to 7 per cent compared to the DAW 50 and Static scales, at levels of significance of a = 1, 5 and 10 per cent. Similar findings were made on the paired data of the axle groups and single axle mass weights. The relative prediction limits of the SIM device ranges between +/- 0.6 tonnes to +/- 4.1 tonnes, depending on the confidence level and mass weight configuration. The precision of the scales were also studied using the well known repeatability (r) and Reproducibility (R) concepts. Four dedicated trucks were measured repeatedly on different days over the three scales. Although standard mass weight limits for r and R were achieved at a a = 5 per cent level of significance, more replica measurements are needed to further improve on the qualification of the precision limits of the SIM system, as well as for the Static and DAW 50 scales. | en |
| dc.language.iso | en | en |
| dc.subject | Vehicle weighing devices | en |
| dc.subject | Heavy Vehicle Simulator | en |
| dc.subject | GVM/GCM | en |
| dc.subject | Gross Vehicle Mass/Gross Combination Mass | en |
| dc.subject | HVS | en |
| dc.title | Statistical analysis of vehicle loads measured with three different vehicle weighing devices | en |
| dc.type | Conference Presentation | en |
| dc.identifier.apacitation | Mkhize, Z., & De Beer, M. (2005). Statistical analysis of vehicle loads measured with three different vehicle weighing devices. http://hdl.handle.net/10204/1866 | en_ZA |
| dc.identifier.chicagocitation | Mkhize, ZQP, and Morris De Beer. "Statistical analysis of vehicle loads measured with three different vehicle weighing devices." (2005): http://hdl.handle.net/10204/1866 | en_ZA |
| dc.identifier.vancouvercitation | Mkhize Z, De Beer M, Statistical analysis of vehicle loads measured with three different vehicle weighing devices; 2005. http://hdl.handle.net/10204/1866 . | en_ZA |
| dc.identifier.ris | TY - Conference Presentation AU - Mkhize, ZQP AU - De Beer, Morris AB - This study introduces a new scale for weighing individual tyres of slow moving vehicles. The new technology is referred to as “Stress - In – Motion” or SIM and is statistically compared with an existing Weigh-In-Motion (WIM) scale (DAW 50) and a Multi-Deck Static scale at the N3 Traffic Control Centre (N3-TCC), near Heidelberg. The raw data was validated for quality, resulting in a total usable sample of 2 297 trucks (12 830 axles) from the SIM device. The validated paired data indicated that the SIM data compares very linearly to the mass weight results of both the DAW 50 and Static scales. However, he SIM data underestimated the average gross vehicle Mass (GVM), or gross combination mass (GCM) by 6 to 7 per cent compared to the DAW 50 and Static scales, at levels of significance of a = 1, 5 and 10 per cent. Similar findings were made on the paired data of the axle groups and single axle mass weights. The relative prediction limits of the SIM device ranges between +/- 0.6 tonnes to +/- 4.1 tonnes, depending on the confidence level and mass weight configuration. The precision of the scales were also studied using the well known repeatability (r) and Reproducibility (R) concepts. Four dedicated trucks were measured repeatedly on different days over the three scales. Although standard mass weight limits for r and R were achieved at a a = 5 per cent level of significance, more replica measurements are needed to further improve on the qualification of the precision limits of the SIM system, as well as for the Static and DAW 50 scales. DA - 2005-07 DB - ResearchSpace DP - CSIR KW - Vehicle weighing devices KW - Heavy Vehicle Simulator KW - GVM/GCM KW - Gross Vehicle Mass/Gross Combination Mass KW - HVS LK - https://researchspace.csir.co.za PY - 2005 T1 - Statistical analysis of vehicle loads measured with three different vehicle weighing devices TI - Statistical analysis of vehicle loads measured with three different vehicle weighing devices UR - http://hdl.handle.net/10204/1866 ER - | en_ZA |
Files in this item
This item appears in the following Collection(s)
Related items
Showing items related by title, author, creator and subject.