JavaScript is disabled for your browser. Some features of this site may not work without it.
- ResearchSpace
- →
- Research Publications/Outputs
- →
- Conference Publications
- →
- View Item
| dc.contributor.author |
Calitz, Joanne R

|
|
| dc.contributor.author |
Wright, Jarrad G
|
|
| dc.date.accessioned | 2021-03-08T15:29:50Z | |
| dc.date.available | 2021-03-08T15:29:50Z | |
| dc.date.issued | 2021-02 | |
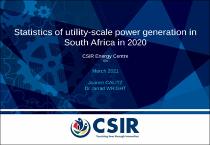
| dc.identifier.citation | Calitz, J.R. & Wright, J.G. 2021. Statistics of utility-scale power generation in South Africa in 2020. http://hdl.handle.net/10204/11865 . | en_ZA |
| dc.identifier.uri | http://hdl.handle.net/10204/11865 | |
| dc.description.abstract | This presentation provides statistics on utility-scale power generation in South Africa in 2020. Coal still dominates the South African energy mix whilst variable renewables surpassed nuclear energy contribution in 2020 by some margin. System demand reduced notably in 2020 due to Covid-19 lockdown and resulting reduced economic activity. 5.6% of system load was supplied by wind, solar PV & CSP in RSA. VRE made a notable energy contribution to the energy mix in 2020 whilst residual demand exhibiting slight increasing need for flexible capacity. 2020 saw 859 hours of loadshedding and seemingly the most intense yet (upper limit 1798 GWh) whilst actually achieved was 1269 GWh. | en_US |
| dc.format | Fulltext | en_US |
| dc.language.iso | en | en_US |
| dc.source | Presentation by the CSIR Energy Centre on the statistics of utility-scale power generation in South Africa in 2020 | en_US |
| dc.subject | Utility-scale power generation | en_US |
| dc.subject | South African power systems | en_US |
| dc.subject | Wind power | en_US |
| dc.subject | Solar power | en_US |
| dc.subject | Coal | en_US |
| dc.subject | Covid-19 lockdown | en_US |
| dc.subject | CSP | en_US |
| dc.subject | REIPPPP | en_US |
| dc.title | Statistics of utility-scale power generation in South Africa in 2020 | en_US |
| dc.type | Conference Presentation | en_US |
| dc.description.pages | 211pp | en_US |
| dc.description.note | Presentation by the CSIR Energy Centre | en_US |
| dc.description.impactarea | Energy Centre (centre) | en_US |
| dc.identifier.apacitation | Calitz, J. R., & Wright, J. G. (2021). Statistics of utility-scale power generation in South Africa in 2020. http://hdl.handle.net/10204/11865 | en_ZA |
| dc.identifier.chicagocitation | Calitz, Joanne R, and Jarrad G Wright. "Statistics of utility-scale power generation in South Africa in 2020." <i>Presentation by the CSIR Energy Centre on the statistics of utility-scale power generation in South Africa in 2020</i> (2021): http://hdl.handle.net/10204/11865 | en_ZA |
| dc.identifier.vancouvercitation | Calitz JR, Wright JG, Statistics of utility-scale power generation in South Africa in 2020; 2021. http://hdl.handle.net/10204/11865 . | en_ZA |
| dc.identifier.ris | TY - Conference Presentation AU - Calitz, Joanne R AU - Wright, Jarrad G AB - This presentation provides statistics on utility-scale power generation in South Africa in 2020. Coal still dominates the South African energy mix whilst variable renewables surpassed nuclear energy contribution in 2020 by some margin. System demand reduced notably in 2020 due to Covid-19 lockdown and resulting reduced economic activity. 5.6% of system load was supplied by wind, solar PV & CSP in RSA. VRE made a notable energy contribution to the energy mix in 2020 whilst residual demand exhibiting slight increasing need for flexible capacity. 2020 saw 859 hours of loadshedding and seemingly the most intense yet (upper limit 1798 GWh) whilst actually achieved was 1269 GWh. DA - 2021-02 DB - ResearchSpace DP - CSIR J1 - Presentation by the CSIR Energy Centre on the statistics of utility-scale power generation in South Africa in 2020 KW - Utility-scale power generation KW - South African power systems KW - Wind power KW - Solar power KW - Coal KW - Covid-19 lockdown KW - CSP KW - REIPPPP LK - https://researchspace.csir.co.za PY - 2021 T1 - Statistics of utility-scale power generation in South Africa in 2020 TI - Statistics of utility-scale power generation in South Africa in 2020 UR - http://hdl.handle.net/10204/11865 ER - | en_ZA |
Files in this item
This item appears in the following Collection(s)
Related items
Showing items related by title, author, creator and subject.